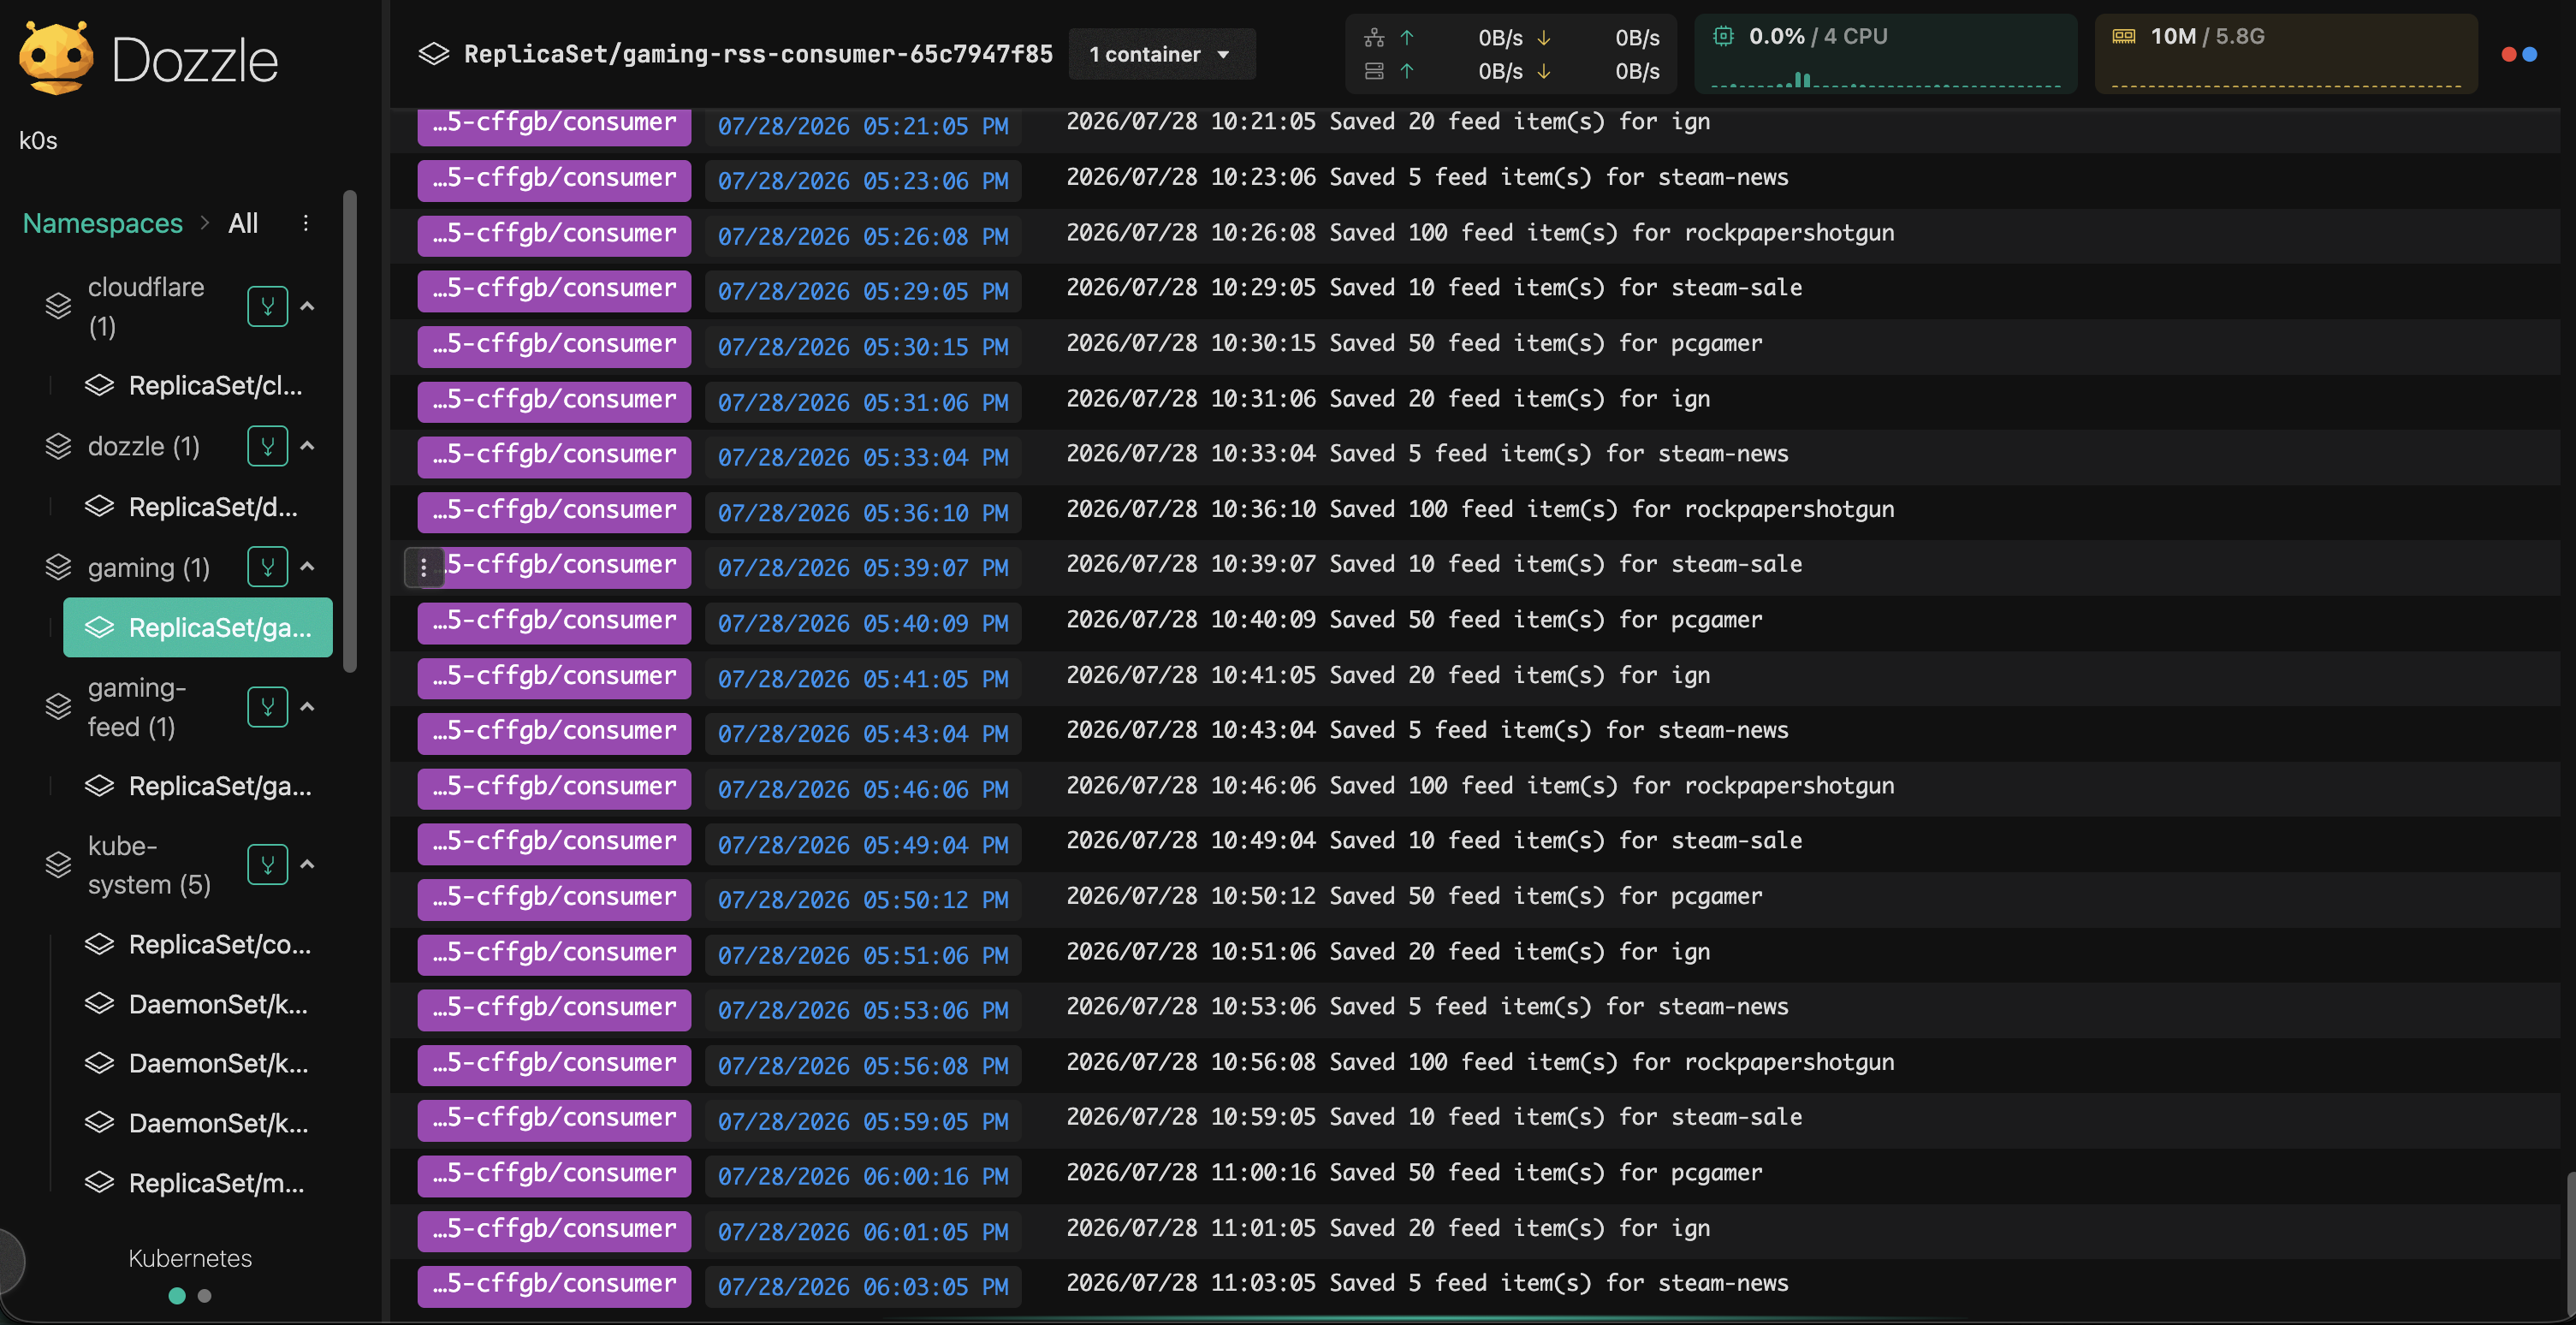
Why I Wanted Dozzle
I maintain a small k0s Kubernetes cluster for my personal services. kubectl logs works fine, but after a while it becomes tiring to keep jumping between namespaces, deployments, replicas, and pod names.
I wanted a lightweight web UI where I could open one page, search for a workload, and read logs without turning every debugging session into a command-line treasure hunt.
Dozzle looked like a good fit because it can run directly in Kubernetes mode. That means I did not need to mount the Docker socket or run a node-level log agent.
The goal was simple:
- view pod logs from the cluster
- keep access read-only
- expose it through the Traefik ingress controller I already had
- route traffic through my existing Cloudflare Tunnel
- protect it with authentication
Existing Cluster Setup
The cluster already had the core pieces in place:
- k0s running as a single-node controller/worker
- Traefik exposed through a
LoadBalancerservice - MetalLB assigning the host address to Traefik
- Metrics Server
cloudflaredrunning inside the cluster- a remotely managed Cloudflare Tunnel
The final request path looks like this:
Browser
  -> Cloudflare
  -> Cloudflare Tunnel
  -> Traefik
  -> Dozzle Service
  -> Dozzle Pod
  -> Kubernetes API
Cloudflare handles the public HTTPS side. The tunnel carries requests into the cluster. Traefik then routes by hostname to the Dozzle service.
Checking the Cluster First
Before deploying anything new, I checked the existing cluster state:
k0s status
k0s kubectl get nodes -o wide
k0s kubectl get ingress,service,deployment -A
At first, the commands failed with API discovery errors. The cluster itself was fine, but my shell had a stale KUBECONFIG environment variable pointing at another config.
Running the command without that variable fixed it:
env -u KUBECONFIG k0s kubectl get nodes
Small reminder for future me: when Kubernetes looks broken, check the local shell state before blaming the cluster.
Dozzle RBAC
Dozzle needs access to pod metadata, pod logs, workload ownership, nodes, and pod metrics. I created a dedicated service account for it:
apiVersion: v1
kind: ServiceAccount
metadata:
  name: dozzle
  namespace: dozzle
Then I gave it only the permissions it needed:
apiVersion: rbac.authorization.k8s.io/v1
kind: ClusterRole
metadata:
  name: dozzle-pod-viewer
rules:
  - apiGroups: [""]
    resources: ["pods", "pods/log", "nodes"]
    verbs: ["get", "list", "watch"]
  - apiGroups: ["apps"]
    resources:
      - deployments
      - replicasets
      - daemonsets
      - statefulsets
    verbs: ["get"]
  - apiGroups: ["batch"]
    resources: ["jobs", "cronjobs"]
    verbs: ["get"]
  - apiGroups: ["metrics.k8s.io"]
    resources: ["pods"]
    verbs: ["get", "list"]
A ClusterRoleBinding connects this role to the dozzle service account in the dozzle namespace.
I deliberately did not grant access to secrets, config maps, pods/exec, or any mutation operations. Dozzle should help me read logs, not become a web shell with a nice UI.
Authentication
Dozzle supports simple file-based authentication. The user file looks like this:
users:
  admin:
    name: Administrator
    password: "<bcrypt-password-hash>"
    filter: ""
    roles: none
The real password hash should not be committed into a public repo. In my deployment, this file is stored as a Kubernetes Secret and mounted read-only into the Dozzle pod:
/data/users.yml
The user file can be generated with the same pinned Dozzle image:
docker run --rm amir20/dozzle:v10.6.2 \
  generate admin \
  --password '<strong-random-password>' \
  --name Administrator \
  --user-roles none
For a more mature setup, I would probably manage the Secret with SOPS or use Cloudflare Access together with Dozzle’s forward-proxy authentication.
Deployment
The deployment runs Dozzle in Kubernetes mode:
apiVersion: apps/v1
kind: Deployment
metadata:
  name: dozzle
  namespace: dozzle
spec:
  replicas: 1
  selector:
    matchLabels:
      app.kubernetes.io/name: dozzle
  template:
    metadata:
      labels:
        app.kubernetes.io/name: dozzle
    spec:
      serviceAccountName: dozzle
      enableServiceLinks: false
      containers:
        - name: dozzle
          image: amir20/dozzle:v10.6.2
          env:
            - name: DOZZLE_MODE
              value: k8s
            - name: DOZZLE_AUTH_PROVIDER
              value: simple
            - name: DOZZLE_AUTH_TTL
              value: 12h
            - name: DOZZLE_ENABLE_ACTIONS
              value: "false"
            - name: DOZZLE_ENABLE_SHELL
              value: "false"
            - name: DOZZLE_ENABLE_MCP
              value: "false"
          ports:
            - name: http
              containerPort: 8080
          volumeMounts:
            - name: users
              mountPath: /data/users.yml
              subPath: users.yml
              readOnly: true
      volumes:
        - name: users
          secret:
            secretName: dozzle-users
I pinned the image to amir20/dozzle:v10.6.2 instead of using latest, so upgrades stay intentional.
I also disabled actions, shell access, and the MCP endpoint. For this cluster, Dozzle only needs to show logs.
The full deployment also includes health probes, resource requests and limits, dropped Linux capabilities, and disabled privilege escalation.
Service and Ingress
Dozzle only needs an internal Kubernetes service:
apiVersion: v1
kind: Service
metadata:
  name: dozzle
  namespace: dozzle
spec:
  selector:
    app.kubernetes.io/name: dozzle
  ports:
    - name: http
      port: 8080
      targetPort: http
Then Traefik routes the public hostname to that service:
apiVersion: networking.k8s.io/v1
kind: Ingress
metadata:
  name: dozzle
  namespace: dozzle
  annotations:
    traefik.ingress.kubernetes.io/router.entrypoints: web,websecure
spec:
  ingressClassName: traefik
  rules:
    - host: dozzle.tyvan.dev
      http:
        paths:
          - path: /
            pathType: Prefix
            backend:
              service:
                name: dozzle
                port:
                  name: http
I applied everything as one manifest:
env -u KUBECONFIG k0s kubectl apply -f dozzle-k0s.yaml
env -u KUBECONFIG k0s kubectl -n dozzle rollout status deployment/dozzle
Cloudflare Tunnel
Because my Cloudflare Tunnel is remotely managed, I added the public hostname from the Cloudflare Zero Trust dashboard.
The hostname config points to Traefik inside the cluster:
Public hostname: dozzle.tyvan.dev
Service type:    HTTP
Service URL:     traefik.traefik.svc.cluster.local:80
Cloudflare creates the proxied DNS record. The tunnel forwards the request to Traefik, and Traefik uses the original Host header to match the Dozzle ingress rule.
No Kubernetes TLS secret is needed in this setup because public HTTPS terminates at Cloudflare and traffic reaches the cluster through the tunnel.
Verification
First, I checked that the Kubernetes resources were created:
env -u KUBECONFIG k0s kubectl -n dozzle get pods,services,ingresses -o wide
env -u KUBECONFIG k0s kubectl -n dozzle logs deployment/dozzle
Then I tested routing through Traefik while sending the expected hostname:
curl -I \
  -H 'Host: dozzle.tyvan.dev' \
  http://<traefik-address>/
The expected response was a redirect to the login page:
HTTP/1.1 307 Temporary Redirect
Location: /login?redirectUrl=/
That confirmed both routing and authentication.
I also checked the important RBAC boundary:
kubectl auth can-i get pods/log \
  --as=system:serviceaccount:dozzle:dozzle \
  --all-namespaces

kubectl auth can-i create pods/exec \
  --as=system:serviceaccount:dozzle:dozzle \
  --all-namespaces
The result I wanted:
yes
no
Dozzle can read logs, but it cannot open shells inside containers. That is exactly the shape I wanted.
A Small 502 Detour
During verification, Traefik briefly returned 502 Bad Gateway.
The ingress config was correct. The request arrived while an old Dozzle pod was terminating during a rollout, so Traefik briefly had no useful backend target.
I checked the endpoint slice:
kubectl -n dozzle get endpointslice
After the new pod became ready, the same request returned the expected login redirect.
Final Result
Dozzle is now available at:
https://dozzle.tyvan.dev
The deployment now gives me:
- a small web UI for Kubernetes logs
- read-only cluster access
- simple bcrypt-backed authentication
- no shell or action features exposed
- Traefik ingress routing
- Cloudflare Tunnel access
- a pinned Dozzle image version
Dozzle does not replace a centralized logging stack like Loki or Elasticsearch. It is much simpler than that.
For this cluster, that is the point. Sometimes I just need to open a page, find a pod, and read what happened.